

Shippers Paid More and Shipped Less in Q2. What That Tells 3PLs About the Market Ahead.

The Cass Freight Index for June 2026 landed last month and the headline numbers are worth sitting with before peak season fully opens.
Freight expenditures rose 11.2% year over year in June, accelerating from a 7.5% gain in May. That sounds like a strong freight market. But the shipments component, which measures actual volume moving through the system, fell again year over year. Shippers paid more and moved less.
That combination is not a contradiction. It is a signal. And for 3PLs trying to make sense of a market that is sending mixed messages from almost every direction, understanding what is actually driving it matters a great deal for how you price new business, manage your carrier mix, and position yourself with clients heading into the second half of 2026.
This post breaks down what the Q2 freight data is actually saying, what the leading indicators suggest about the months ahead, and what 3PL operators need to be thinking about right now.
The Q2 Numbers in Context
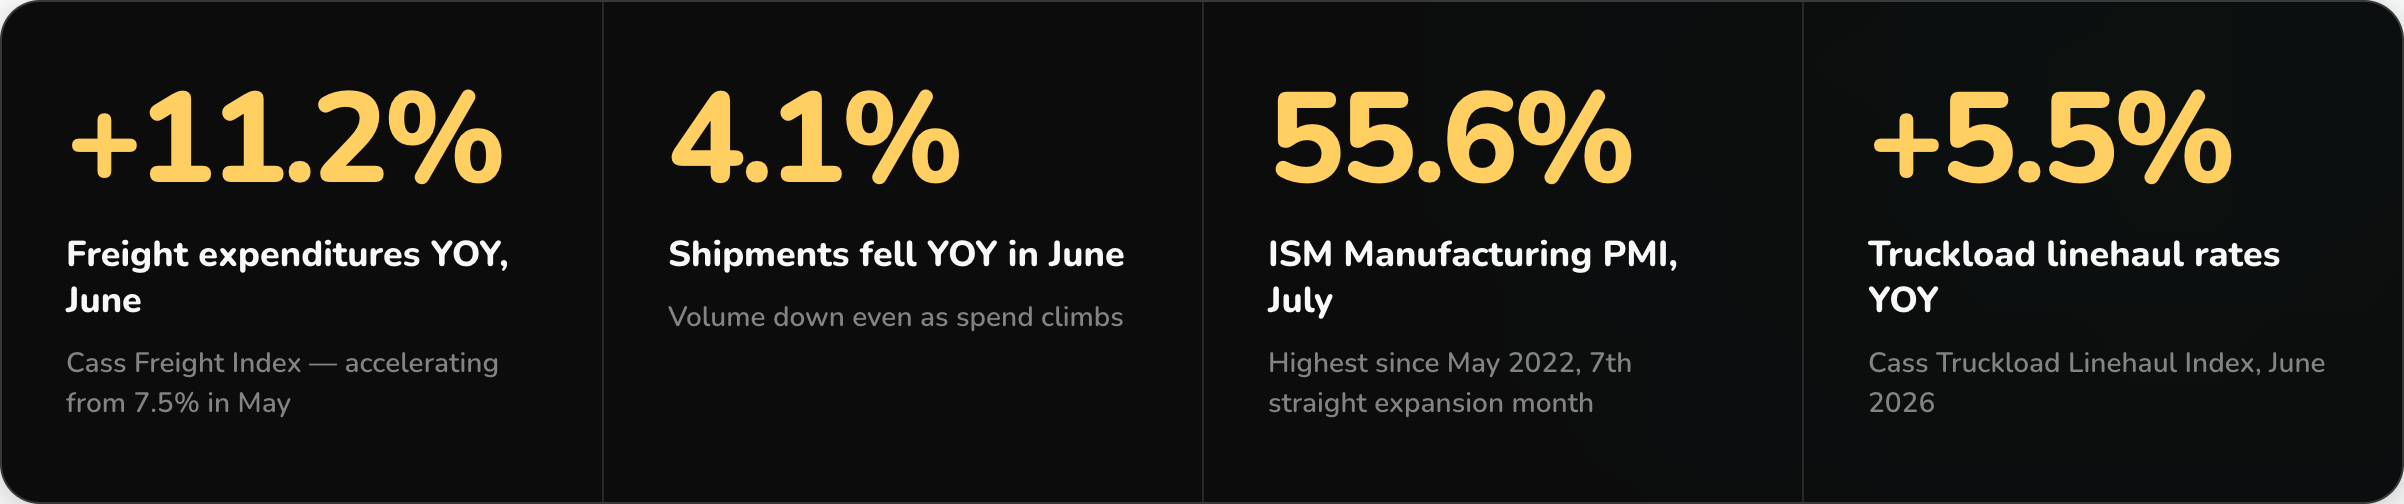
The divergence between expenditures and shipments is the most important thing in that data set. When shippers are spending more but moving less, the explanation is almost always rates. Capacity got tighter, rates moved up, and the total bill grew even though the freight volume behind it did not.
That is exactly what the Cass data confirms. The June acceleration in expenditures was driven mainly by rates while volumes stepped back. Shippers are not suddenly generating more freight. They are paying significantly more for the freight they were already moving.
For 3PLs, this matters in two ways. First, it means your clients are absorbing freight cost increases that they may not have fully anticipated when they budgeted for the year. That creates pricing pressure and, in some cases, pushback on your rates even as your own carrier costs are rising. Second, it means the market environment that produced this data is not a temporary anomaly. The structural conditions driving it are still in place and in some areas are tightening further.
What Is Actually Driving This Market
The freight market in Q2 2026 is being shaped by a supply-side contraction that started building in late 2024 and has not reversed. Understanding the specific drivers helps 3PLs think more clearly about what the second half of the year is likely to look like.
Carrier Capacity Has Structurally Contracted
The driver shortage that was a persistent background concern for years has moved from chronic to acute. New CDL nondomicile rules that took effect in March 2026 are weighing on the driver market. Net fleet counts continue declining. Carrier authorities are not being granted at the pace needed to offset attrition. The supply of available capacity is shrinking, and it is doing so in a way that is not easily or quickly reversible.
The Cass Truckload Linehaul Index reflects this clearly. It rose 5.5% year over year in June, up from a 5.6% gain in May, sustaining a rate environment that is well above where it was a year ago. This is not a temporary rate spike driven by a weather event or a holiday. It is the output of a market where capacity has been structurally reduced and has not been replaced.
Tariffs Reshaped the Import Cadence
The tariff environment in 2025 and early 2026 created a front-loading pattern that pulled significant import volume forward into Q1 and Q4 2025. Shippers accelerated orders to beat tariff effective dates, which generated outsized freight volume during those periods. The payback from that front-loading contributed to the softer shipments numbers in Q2 as the inventory that had been pulled forward worked its way through the supply chain.
This matters for 3PLs because it means some of the volume softness in Q2 is a hangover from unusually strong prior period demand rather than a sign of weakening underlying consumption. Private domestic demand grew at 3.9% annualized in Q2, nearly double the Q1 pace. The freight volume is coming. It just arrived early and is now being distributed across the system.
Manufacturing Is Expanding and Industrial Freight Is Building
The ISM Manufacturing PMI hit 55.6% in July, the highest reading since May 2022 and the seventh consecutive month above 50. The Production Index surged to 58.5. The Employment Index reached 52.8, its first expansionary reading in nearly three years.
Seven consecutive months of manufacturing expansion translate directly into sustained and accelerating industrial freight demand on truckload and flatbed lanes. The brands and manufacturers who use 3PLs for inbound and outbound freight are generating more volume, not less. That volume is going to need to move, and it is going to move in a market where available capacity is constrained.
For 3PLs, this is the leading indicator that matters most heading into Q3 and Q4. The freight volumes your clients will need you to move in September and October are being generated by manufacturing activity happening right now. The question is whether your carrier relationships, routing strategy, and billing infrastructure are ready for the volume when it arrives.
What Mixed Signals Mean for 3PL Bidding
One of the practical challenges this market creates is for 3PLs who are actively bidding on new business. The data is sending what feels like mixed signals: shipments are soft, but rates are elevated. Manufacturing is expanding, but volumes have not fully materialized yet. Capacity is tight, but tender rejections have eased from their peak.
The operators who read that as a soft market and bid conservatively on new business are going to be underpriced by Q4. The operators who read it as a uniformly hard market and build in large buffers on every quote may win less business than the opportunity warrants.
The right read is more nuanced. This is a supply-driven freight cycle where rates are structurally elevated because of capacity constraints, not because of demand surge. That means rates are likely to hold even if volumes remain soft, and they are likely to move higher if manufacturing demand translates into stronger freight volumes as expected heading into fall.
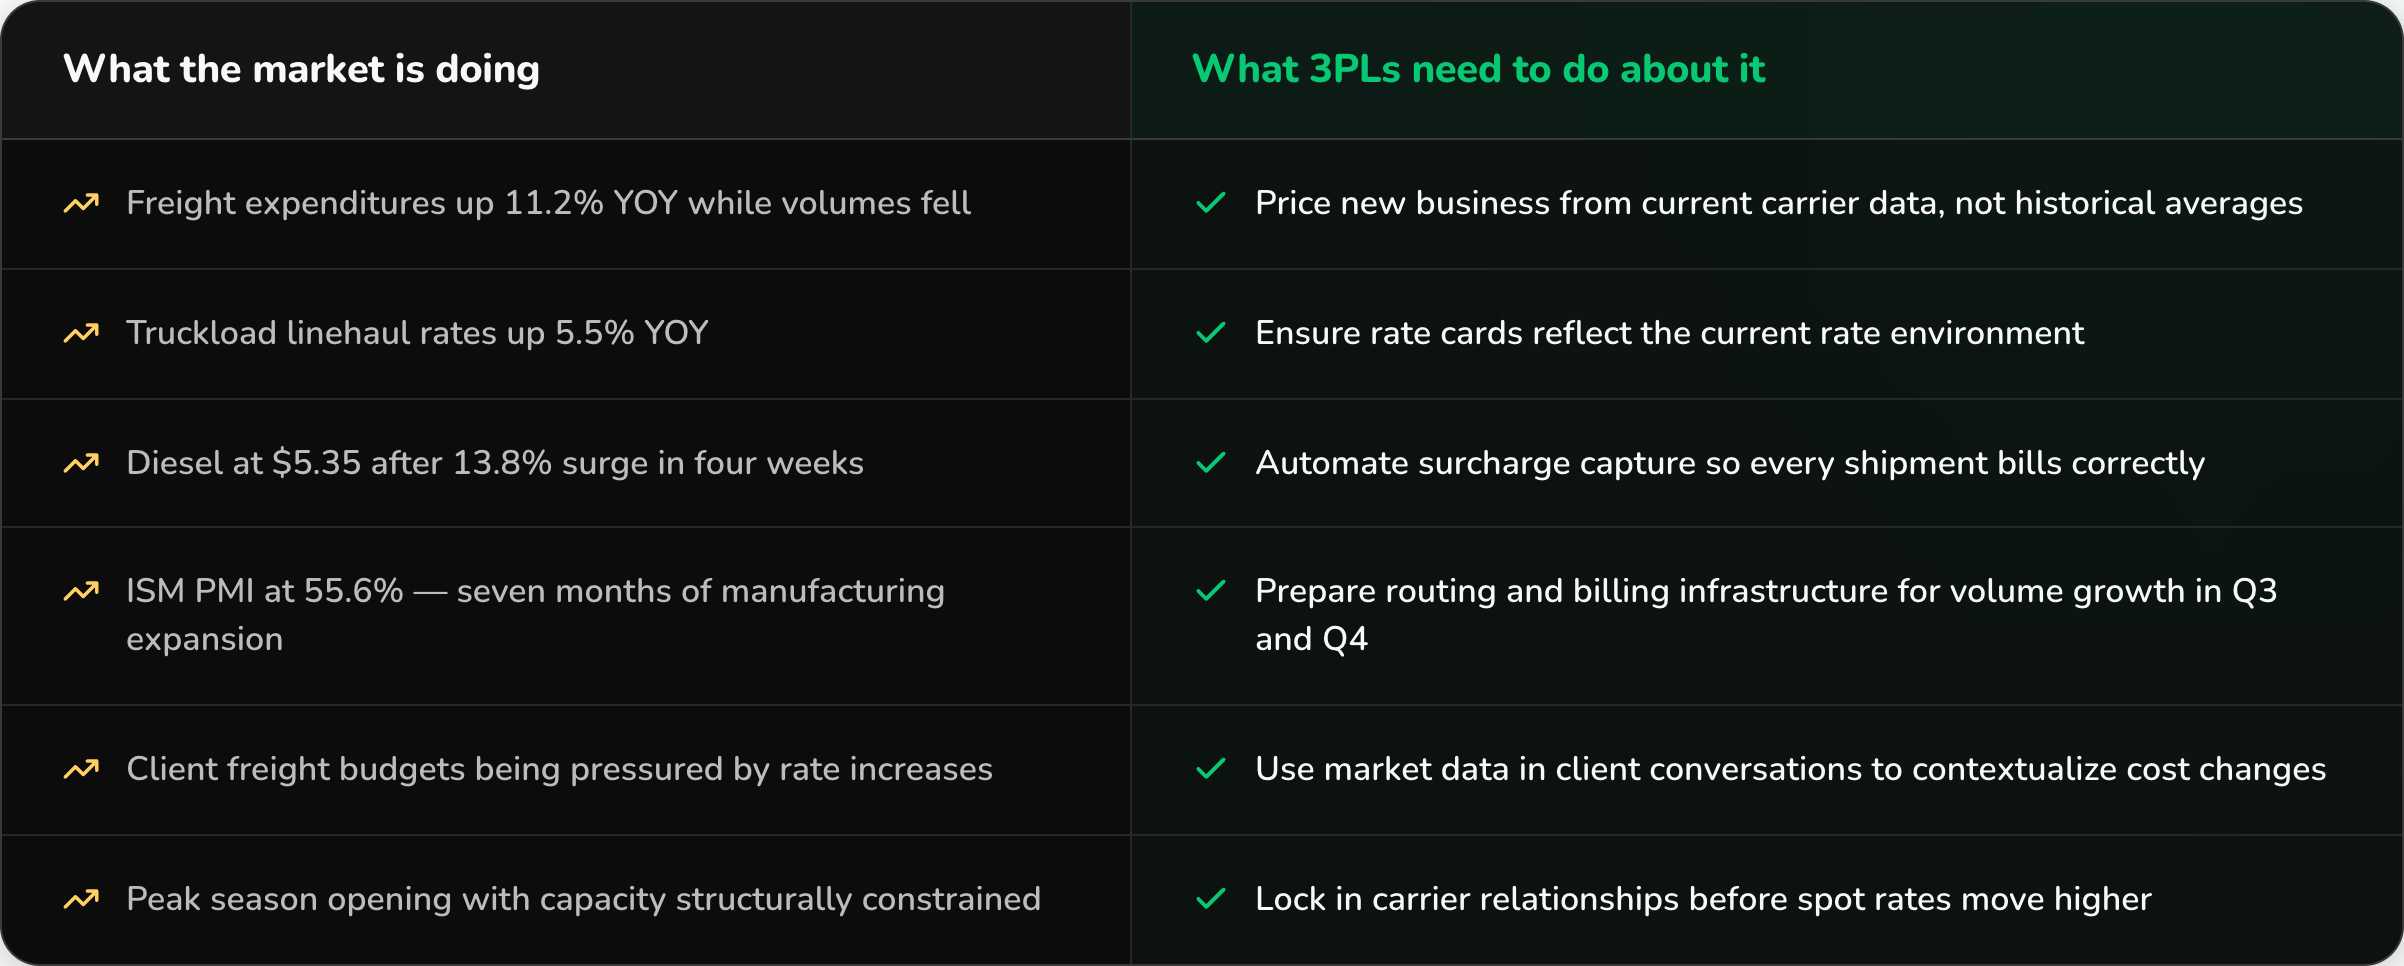
For 3PL bidding, the implication is that building quotes from current carrier cost data rather than historical averages has never mattered more. The operator using Q4 2024 rates as a baseline for a bid submitted today is going to misprice. The operator pulling from live rate data, with current surcharge levels applied, is pricing from the actual market, not the memory of one.
What This Market Means for Client Conversations
The freight cost increases your clients are experiencing are real and documented. The Cass data shows expenditures up 11.2% year over year. Truckload linehaul rates are up 5.5%. Diesel is at $5.35 per gallon. These are not numbers you have to argue from a position of theory. They are published, verifiable, and consistent across multiple authoritative sources.
That gives 3PLs an unusual opportunity in client conversations right now. The operators who can walk into a rate discussion with current market data, explain exactly what is happening to carrier costs and why, and show clients what their freight spend looks like relative to the market are having a fundamentally different conversation than operators who are defending their rates without context.
This is where billing transparency and market intelligence become retention tools, not just operational capabilities. A client who understands why their freight costs have moved, because their 3PL showed them the data rather than just sending a revised rate card, is a client who is much less likely to shop the business to a competitor who will not give them that context.
The H2 2026 Setup for 3PLs
Pull all of this together and the picture for the second half of 2026 is fairly clear, even if the specific timing is not.
Capacity is constrained and not recovering quickly. Manufacturing is expanding and will generate freight demand through Q3 and Q4. Peak season is opening into a market where spot rates will move higher once demand fully materializes. Carrier costs are elevated and the surcharge environment has reset upward after the July diesel surge.
For 3PLs, this sets up as a period where the operators with accurate billing, dynamic routing, and live cost data in their bidding process are going to outperform those who are working from approximations and outdated inputs.
The freight volume is coming. The rates are already there. The question is whether your operation is positioned to capture the margin that the market is making available, or whether billing gaps, stale rate cards, and static routing decisions are going to absorb it before it reaches your bottom line.
How DiversiFi Helps 3PLs Navigate This Market
The market conditions described in this post are exactly why DiversiFi built what it built.
When freight expenditures are rising faster than volumes, billing accuracy is margin protection. Every missed surcharge, every stale rate card, every carrier invoice that does not get reconciled before the client bill goes out is money absorbed from a margin that is already under pressure. AI Dynamic Billing closes those gaps automatically, so the 11.2% expenditure environment does not become your problem to absorb.
When live carrier cost data matters more than ever for bidding, Bid Boost puts that data into every proposal your team builds. You are not estimating. You are pricing from the actual market, which means you can compete confidently without padding uncertainty into your quotes.
And when the carrier mix is shifting, capacity is tighter, and peak season is approaching, AI Carrier Routing evaluates your full carrier options against current cost and performance data on every shipment rather than defaulting to a guide that was built for a different market.
The freight market in H2 2026 is going to reward operators who have their data and their systems in order. If you want to understand where your current operation stands relative to the market conditions in this post, we can model it out. Most 3PLs find the gap between where they are and where the market is taking them is smaller to close than they expected.
The data is telling you what is coming. The only question is whether your operation is ready for it.
Continue learning

See AI for your 3PL In Action
Discover how our solutions can drive your success.